
The U.S. Treasury yield curve is a snapshot of yields across maturities for Treasury securities. Maturity runs along the horizontal axis and yield along the vertical axis. Because the securities share the same sovereign issuer, the curve helps isolate how maturity and market conditions affect yield without mixing in different corporate credit profiles.
How a Treasury curve is constructed
A curve can be based on actively traded securities or on model-based par yield curve rates published by Treasury. Bills, notes and bonds have different coupon structures, so a model helps produce comparable points across maturities.
The curve is not one security's interest rate. It is a set of observations or estimates at a particular time. Data sources can differ by date, methodology and maturity selection, so compare like with like.
Normal, flat, inverted and steep curves
| Shape | Relationship across maturities | Careful interpretation |
|---|---|---|
| Upward sloping or “normal” | Longer-term yields exceed shorter-term yields | Can reflect term premiums, expected rates, inflation and supply-demand conditions |
| Flat | Short- and long-term yields are close | Can occur during transitions; does not identify a cause by itself |
| Inverted | Some shorter-term yields exceed longer-term yields | Has preceded many U.S. recessions, but timing and outcomes are not certain |
| Steepening | A selected long-minus-short spread becomes larger | Can result from long yields rising, short yields falling, or both |
| Flattening | A selected spread becomes smaller | Must be decomposed into changes at each maturity |
Reading a yield spread
A commonly watched measure subtracts a shorter-term Treasury yield from a longer-term yield. For example, the 10-year minus 2-year spread is one measure; the 10-year minus 3-month spread is another.
If the 10-year yield is 4.2% and the 2-year yield is 4.5%, the 10-year minus 2-year spread is −0.3 percentage points, or −30 basis points. The negative sign describes that specific segment as inverted. It does not mean every point on the curve is inverted.
What can move the curve?
- Policy-rate expectations: anticipated Federal Reserve decisions can strongly influence shorter maturities.
- Inflation expectations: expected purchasing-power changes can affect nominal yields.
- Real-rate expectations: growth and real interest-rate outlooks can shift multiple maturities.
- Term premium: compensation demanded for longer-maturity uncertainty can change.
- Supply and demand: issuance, institutional demand, regulation and safe-haven flows can affect prices.
- Liquidity: individual securities can trade differently based on market depth and auction status.
No single explanation should be inferred solely from one day's curve movement.
Does inversion predict a recession?
Treasury curve inversion has historically preceded many U.S. recessions, which is why it receives attention. But it is not a mechanical timer or a guarantee. The chosen maturities, duration and depth of inversion, economic context and policy response all matter.
A curve can also return to a positive slope before a downturn, during one, or without one. Using the curve as a standalone trading signal ignores uncertainty and the possibility that prices already reflect widely held expectations.
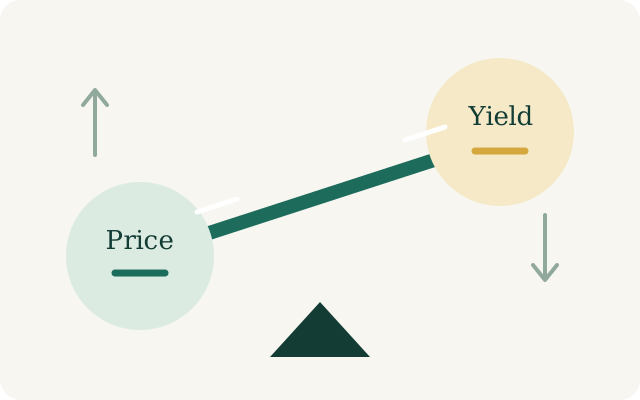
Why yields and bond prices move together—in opposite directions
Existing Treasury cash flows are largely fixed by contract. When market participants demand a higher yield, the price of those fixed payments falls. When the required yield falls, the price rises. Longer-duration securities are generally more sensitive to a given change in yield.
Curve changes are rarely identical at every maturity. A “parallel shift” is a useful simplification, but actual markets can steepen, flatten or twist. Our bond prices and duration guide explains the price-yield relationship in detail.
Nominal and real yield curves
Conventional Treasury yields are nominal. TIPS yields are real yields associated with inflation-adjusted principal. Comparing matched conventional and TIPS maturities can produce a breakeven inflation measure.
That comparison is not a pure inflation forecast: liquidity and risk premiums can differ. Read how TIPS work before interpreting real yields or breakeven rates.
How to read current curve data
- Record the source, date, time and curve methodology.
- Use consistent maturities when comparing two dates.
- Check whether the displayed figures are par yields, market yields or another measure.
- Calculate spreads in percentage points or basis points, not ambiguous percentages.
- Separate short-end and long-end movements when describing steepening or flattening.
- Avoid treating a curve shape as personalized investment guidance.
Official daily par yield curve rates are available from the U.S. Treasury's interest-rate statistics. Historical series are also available through Federal Reserve Economic Data (FRED).
Official data and educational sources
- U.S. Treasury — Interest rate statistics.
- Federal Reserve Bank of St. Louis — FRED.
- TreasuryDirect — Marketable securities.
- Federal Reserve Bank of New York — Yield curve background.
Reviewed November 6, 2026. Numerical examples are hypothetical, not current market quotations or economic forecasts.